The Power of Design + Data to Inform, Engage and Inspire Compelling Change
There are two undeniable business realities that exist in our culture today: constant connectivity and information overload. Our rapidly shifting technologic landscape, coupled with how our brains work, has created a new necessity: to become expert visual storytellers.
To contextualize the conversation, I’d like to first talk a bit about the “why” that has driven the need for this type of storytelling:
Ginormous Data
-
-
- 90% of the data in the world today has been created in the last two years alone. We receive 5x as much information as we did two decades ago.
- Information is coming at us faster than we can process it. We are talking about zettabytes of information – as in 1,000,000,000,000,000,000,000 bytes. (That’s a lot of zeros after that 1.)
- The critical takeaway is that we are living in a business environment where data collection is outpacing data storytelling.
-
Processing Fatigue
-
-
- We are culturally suffering from processing fatigue. Every email, every deck, every status update, every tweet, and every message we read or send is competing for resources in our brains.
- Result: Our brains are tired because of how our brains work. The decision-making networks in our brains don’t prioritize. As Daniel J. Levitin states in his book, The Organized Mind, “It’s as though our brains are configured to make a certain number of decisions per day — and once we reach the limits, we can’t make any more, regardless of how important they are.”
-
Visual Wiring
-
-
- Humans are visually wired. There is power in imagery. We can process a visual scene much quicker than we can when laboring over copious amounts of copy.
- And when presented with information overload, expediting processing and understanding is critical.
- Important: visual presentation has been proven to be more persuasive than presentation with words alone, and affects decision-making accordingly.
-
Emotional Connection
-
-
- In our tech-infiltrated landscape, connecting emotionally is key; the best-remembered stories and experiences are distinctive, with a strong emotional component.
- It goes back to how our brain works – like a bottomless junk drawer without organization. To counteract that, our brains use certain triggers to recall information. The more triggers, the easier to recall.
- Emotion is a key trigger. Important: people connect first with their hearts — and only then with their minds.
-
So, what does this mean for businesses, brands and marketers? How do we address these realities to help them drive action? Two things:
1. Designers = Your new BFFs
We need to embrace design thinking. When engaged properly, design is a very powerful business tool. Why? Because of the following:
-
-
- Design visualizes the abstract.
- Design stimulates dialogue.
- Design simplifies the complicated.
- Design enhances comprehension.
- Design solidifies mutual understanding.
- Design creates emotional connections.
- Design aligns a way forward.
- Design improves outcomes.
-
2. Designers + Analysts + Strategists = One Hot Threesome
Understanding the Power of Design is critical within our current cultural context, but exponential strength exists as a collective powerhouse, when combined with these other key business disciplines.
We have a new responsibility to help our clients sift through, analyze, understand and harness data relevant to their business — and the consumers with whom they are trying to connect — in a manner that can fuel positive momentum for a brand.
-
-
- Data is only powerful if harnessed appropriately.
- Data, without insights, is just noise.
- Insights, without comprehension, don’t drive action.
- And comprehension is to a great extent, dependent on how well those insights are visualized.
-

As custodians of our brands and our clients’ brands, we need to improve our ability to visualize data and better communicate insights to provide historic, current and predictive views of opportunities.
Through the lens of the collective powerhouse, what roles do each discipline play in the development of visual storytelling to gain mutual understanding that can then drive compelling change?
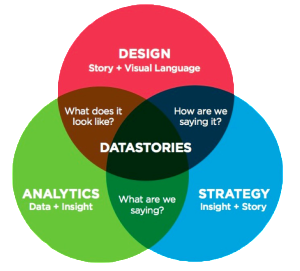
 ANALYTICS (Data + Insight):
-What data should we explore?
-What is the data telling us?
-How is it useful?
STRATEGY (Insight + Story):
-What story do we want to tell?
-Who do we want to tell?
-Should this storytelling process be repeatable?
DESIGN (Story + Visual Language):
-How do we tell the story in a beautiful, clear, visually engaging and comprehensible way?
-What are the right resources and tools to do so?
-Is the data and insight accurately represented?
By approaching analytic storytelling in a collaborative and connective fashion, we empower each discipline to focus on their key strengths. It is about creating a shared mutual understanding of the role each plays, the value they provide, what they think about and why they do what they do. Mutual understanding is the key to effective collaboration.
This approach allows businesses to:
-
-
- Enhance report clarity and comprehension.
- Expedite turning data into insights into actions.
- Create repeatable, automated reporting processes to increase efficiency and better inform.
- Create custom, engaging, insight-driven narratives to drive action.
-
As we utilize analytic storytelling to help compel change, here are a few specific things we should think about and consider along the journey:
Appropriateness Is the visual and technological approach appropriate for the brand? The type of narrative? The audience? The desired outcome? Different types of information require different communication and visualization approaches. Using the right approach at the right time is critical to analytic storytelling success. Think about what you can do to enhance the narrative to impact the audience in a way that helps them relate directly to it. Stories people relate to have the most impact.
Diversity How we visualize the data story or insights should be brand-consistent, but we need to consider diversity in how we bring the narratives to life. As we see a surge in information design, I feel like we’re also seeing a surge in the same infographic visualizations. Designers typically have a diverse arsenal of tools and cues to work with, and they need to be considered: photographic imagery, iconography, typography, motion, specialized views, drawing, or hand illustration.
Clarification The more complex the information is, the greater the cognitive load to process it, and the greater the need for design to clarify. Think about using simplification, visual segmentation or specialized views to organize complex information and provide clarity and focus.
Humility As our data and technological landscape evolve at the speed of light, and our cultural norms shift to adapt, our visual storytelling solutions must too. This requires us to stay humble and admit that we don’t have all the answers. We’re all just scratching the surface. As German mathematician and computer art pioneer, Frieder Nake phrased it, “When you’re asked a question of which you have no answer, you learn … A gap exists in between those who are visual vs. those who are algorithmic. We haven’t found the sweet space yet.” We need to remain sponges thirsty for learning in this area of constant and exciting evolution.
I will leave you with a few parting thoughts that hopefully inspire you to consider embracing the power of visual storytelling:
-
-
- Do what you can, with what you have, where you are.
- Create magic for your audience.
- Be inquisitive.
- Provoke someone to think in a different way to solve a problem.
- Get inspired by looking at stuff that moves you.
-
Written by: Michele Silvestri, EVP, Global Director of Design, WPP’s Team Detroit (@TeamDetroit)
SXSW Presentation: Visual Storytelling: The Power of Design + Data to Inform, Engage and Inspire Compelling Change
TAGS: SXSW
 Interviewer Interview Prep
 Impactful Mentees
 Benefits of a Mentor
 Advice for First-Time Managers
 Overcoming the 18-month Itch
 Dressing for Your Style
 Interview Style Tips
 Women's Stocking Stuffers
 Gift the Busy Traveler
 Father’s Day Gift Guide
 Airport Layover Activities
 Traveling & Eating Healthy
 Travel Like a Boss Lady
 The Dual California Life
 Gifts for Thanksgiving
 Summer Reading List
 Top Leisurely Reads
 New Year, New Books
 Life Lessons from a Sitcom
 Oprah, Amy or Amal?


